Company Overview
Tanijoy is a startup which provides an Agriculture Peer-to-Peer Lending Platform — Most people also know it as an online agriculture investment platform. This platform helps connecting farmers to investors and vice versa. Investors are able to fund farmer projects and get the return. Farmers are also able to get fund from investors to run their farming projects and sell the crop to the market.
Brief
Online investment platform was a new thing in 2018, especially in the agriculture sector. Delivering investment reports was become a standard due to the lack of trust in online investment among Indonesians at that time. However, most of the competitors had not yet offered a good experience in terms of delivering investment reports. If Tanijoy can provide a better delivering report experience, this will be an opportunity to gain investor trust and lead to more sales. How Tanijoy can provide a better delivering reports experience on their mobile app?
Role
UI/UX Designer (Research and Design)
Target User
Tanijoy Investor (end-customer)
Tools
Sticky notes, Figma, draw.io, Google Form, Google Docs
Design Approach
We adapt the Design Thinking approach into our design process. Design Thinking framework offers a successful innovation by generating solution based on user needs to solve the problem. Here are the steps:
👂🏽 1. Understanding
Define the root cause of the problem by empathizing and understanding user needs, motivation, and pain points.
💡 2. Ideation
Generate ideas together to solve the problem which intersect with usability, feasibility, and viability.
📱 3. High Fidelity
Turn ideas into interactive prototype so we can test and explore the idea before it’s launched.
🧪 4. User Testing
Test the prototype directly to the user to ensure whether the idea is able to solve the problem and satisfy the user.
👂🏽 Understanding
Research Plan
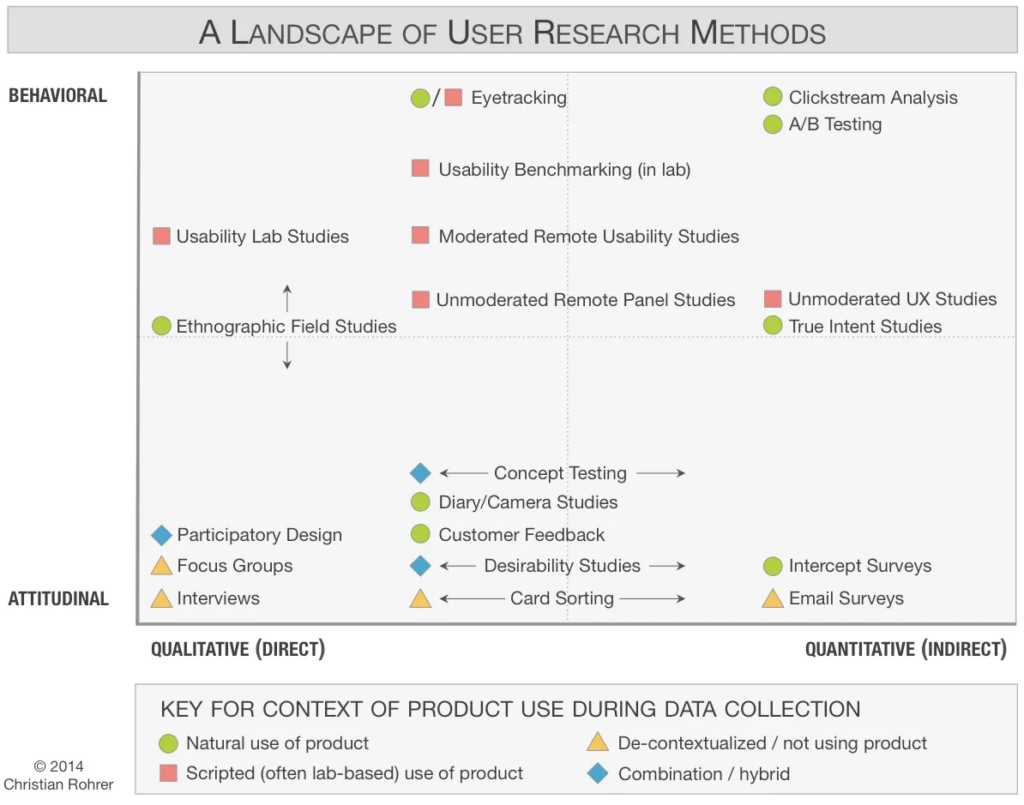
Planning the research helped us to determine the research method according to the type of data we hoped for. Here are the methods we used:

🎙️ User Interview
Goals: understanding user needs, motivation, and user problem while investing in online platform
Data type: qualitative
Duration: 3 days
Participant: 3 investor
📄 Affinity Diagram
Goals: analyze, synthesize, and transform user interview data into insights
Data type: qualitative
Duration: 1-2 days
Participant: 2 people
📝 Questionnaire
Goals: getting the hierarchy of the most needed information for crafting the UI
Data type: quantitative
Duration: +/- 7 days
Target Participant: 75 people
🕵🏻♂️ Benchmarking
Goals: evaluate existing products in the market, gather common design pattern for creating UI
Data type: qualitative
time: N/A
Target: 3 competitors and some apps beyond competitor
Translating User Interview into User Needs with Affinity Diagram
We conducted user interviews to understand user needs and problems. We invited 3 participants who are loyal investor, regular investor, and non-investor who has never used any other investment platform. Our challenges were, as an early-stage startup company, we didn’t have plenty of time and recourse.
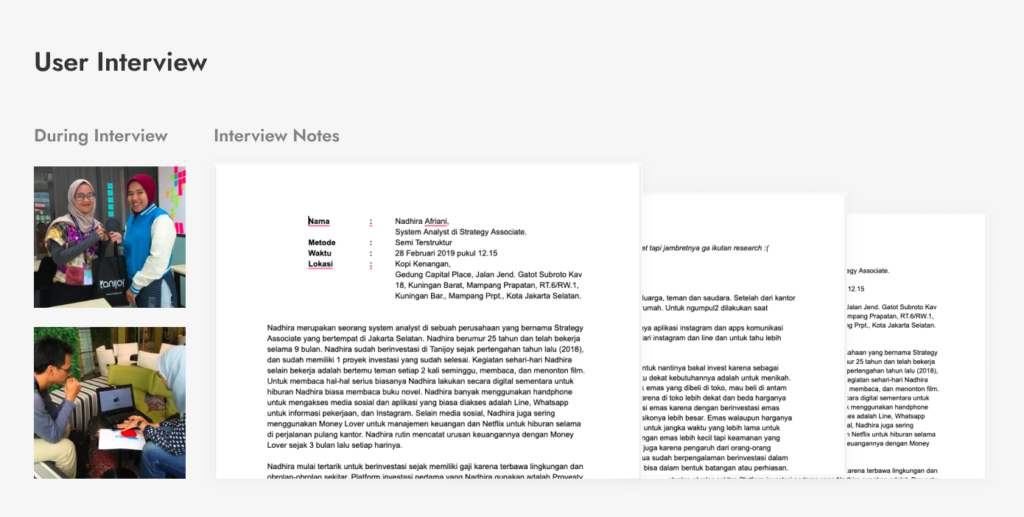
We used Affinity Diagram to extract the interview data into user needs.
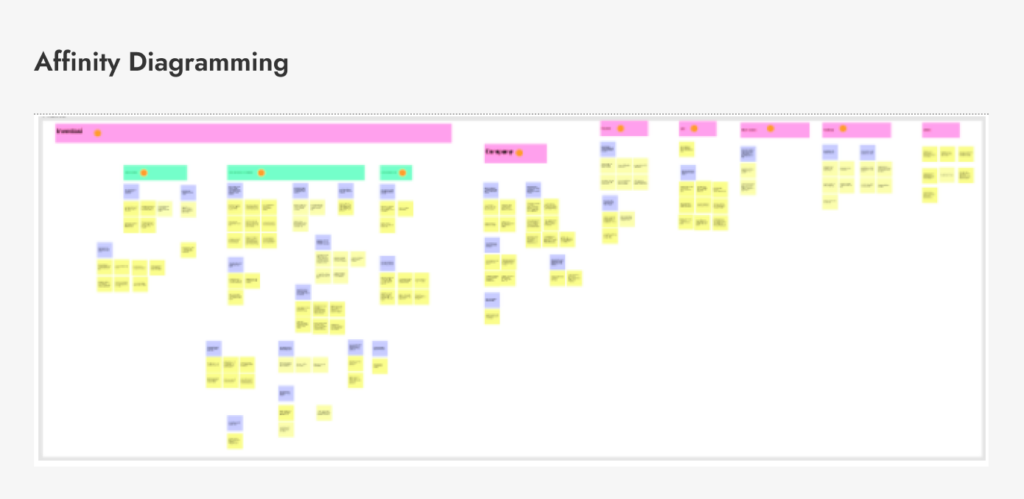
Here are some insights we found:
💬 I need a transparent, on time, and consistent investment report
💬 I usually consider the return, risk, and period before investing.
💬 I need to know how far is the platform has involved in their investment project
💬 I consider their finished investment projects when choosing the platform
We generated a User Problem Statement according to the affinity diagram.
I doubt online investment sometimes, because they don’t provide a transparent, on time, and consistent investment report
Then we turned it into how might we question to help us address the problem.
How might we provide a better transparent, on time, and consistent investment report to users?
Translating questionnaires into Information Hierarchy
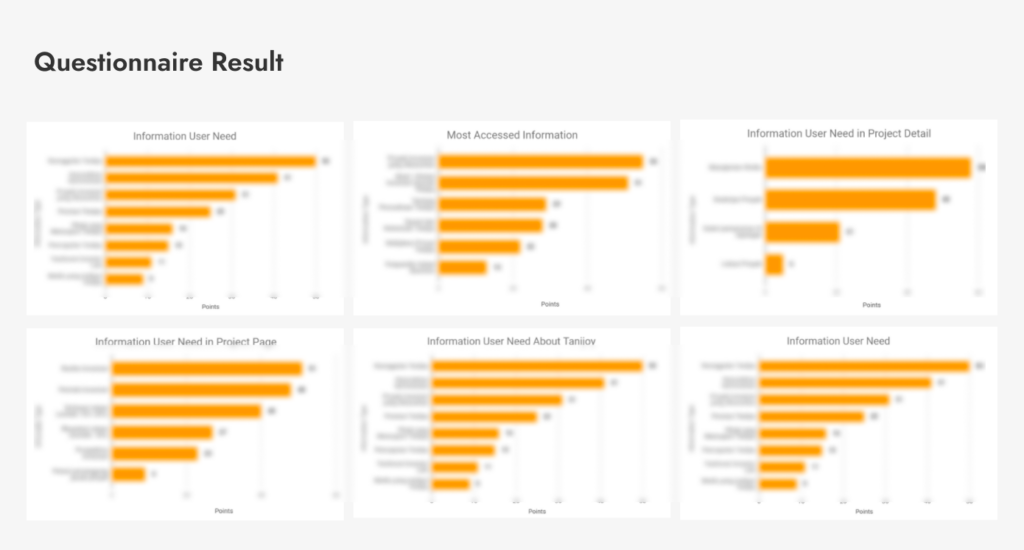
We spread questionnaires to 75 investors during the research process in order to find out the order of information most needed while investing. The data would be used as insights for designing the information hierarchy while crafting the User Interfaces.
Benchmarking
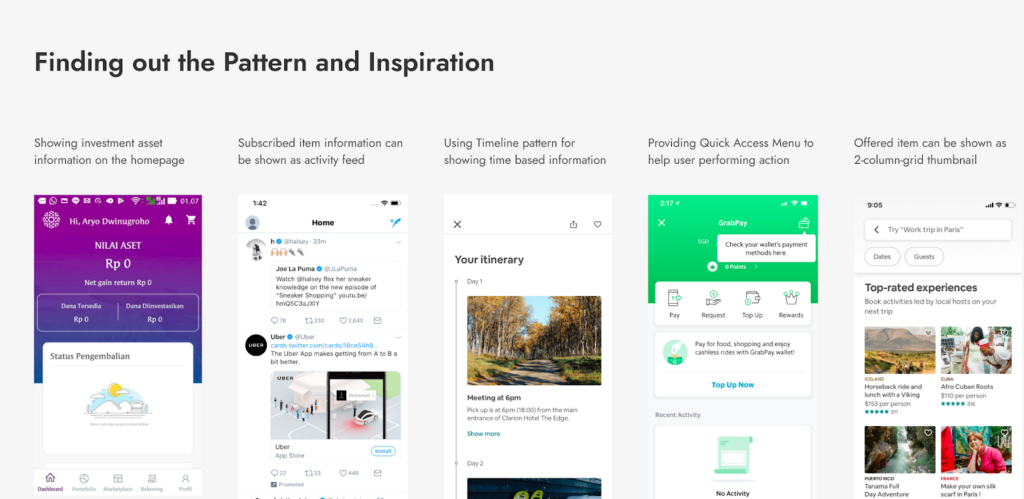
In order to solve the problem, we collected ideas by staring at the nearest competitor to discover features and pattern which became a standard in the market. We also glanced at apps beyond our domain to get more inspiration because we believe there are many same problems have been solved in different contexts by other apps out there.
💡 Ideation
Brainstorming Workshop
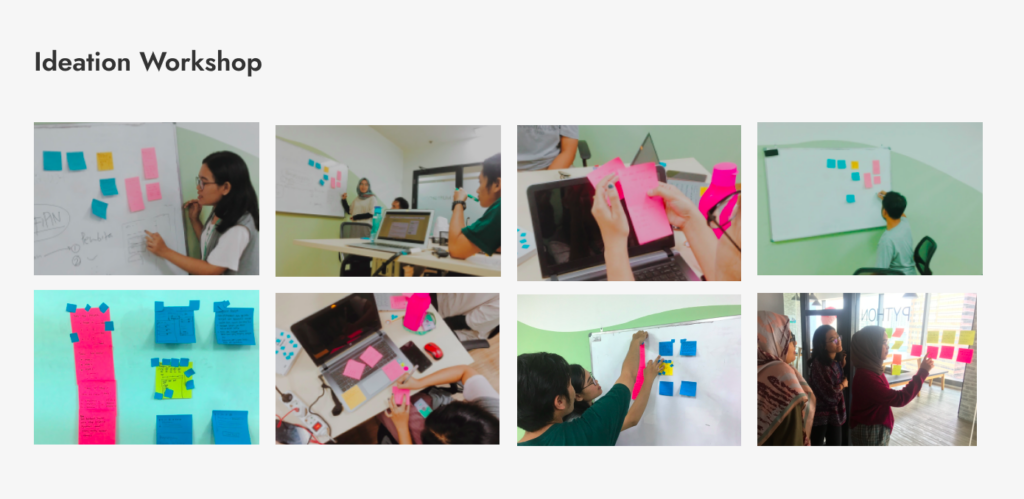
We brought the user problem into KJ Brainstorming workshop to generate solutions as many as possible. The session ended up with Dot Voting to pick up the most reliable ideas. Designers, researcher, system analyst, product owner, and developers had been invited to this workshop In order to achieve the Ux Sweet Spot.

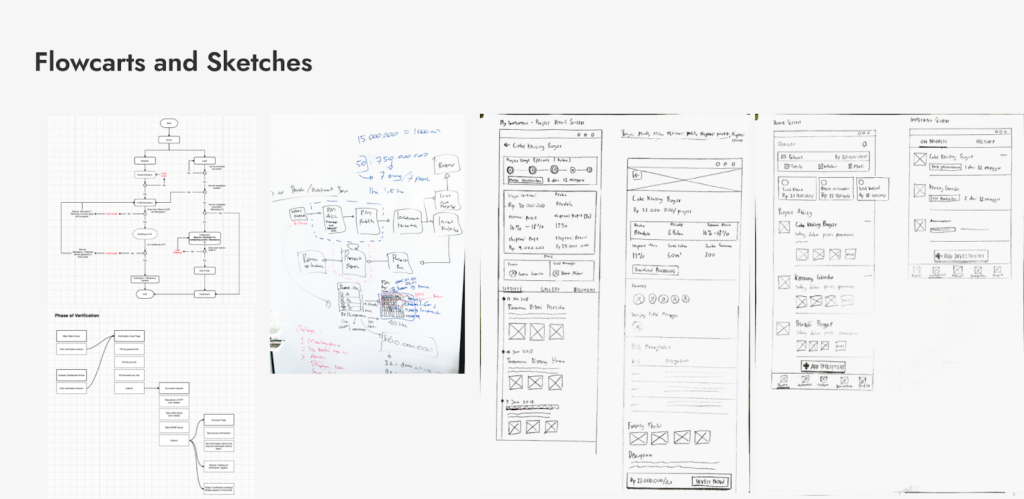
Based on picked up ideas, we drew flowcharts to determine the app’s flow and we sketched various possible screen alternatives.
📱 High Fidelity
Crafting High Fidelity
Design Goals:
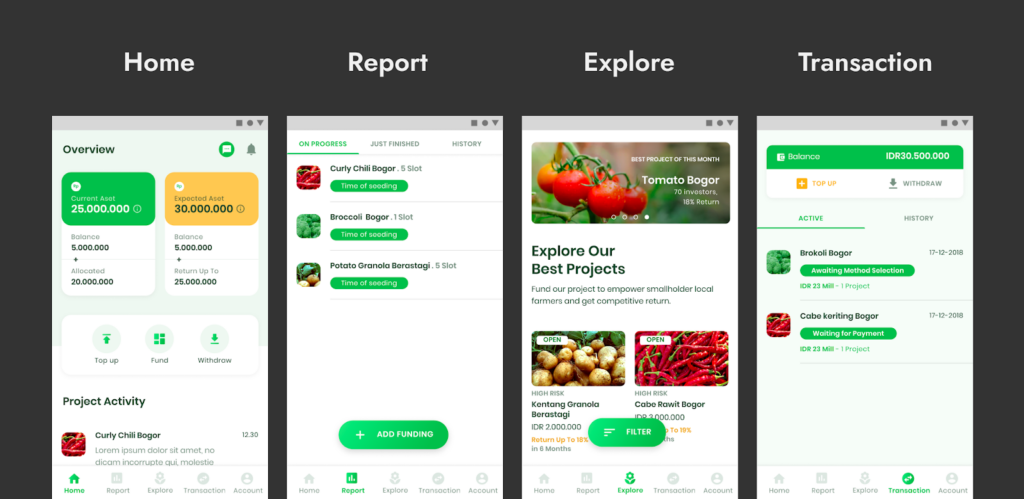
Users are able to get near-real-time reports directly from the field with ease.
Users can invest in the project in a simple, fast, and efficient way.
Home: Report Overview
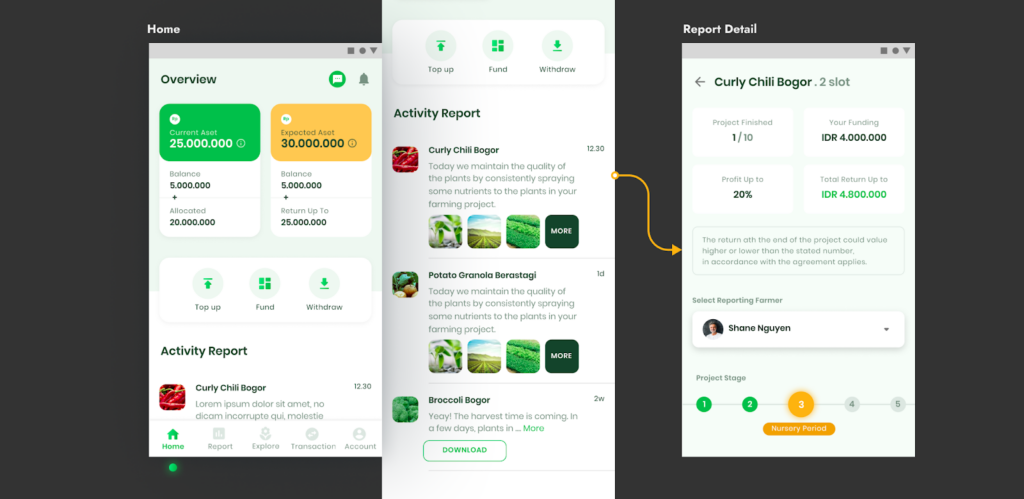
- Providing asset information to inform about their portfolio. This keeps user feeling motivated.
- Providing Quick Action to help users easier to perform three main actions: Top-up, Fund, and Withdraw
- Near-real-time report is shown as “Project Activity”. This helps user to get transparent, on-time and consistent investment reports from all projects.
Detailed Report
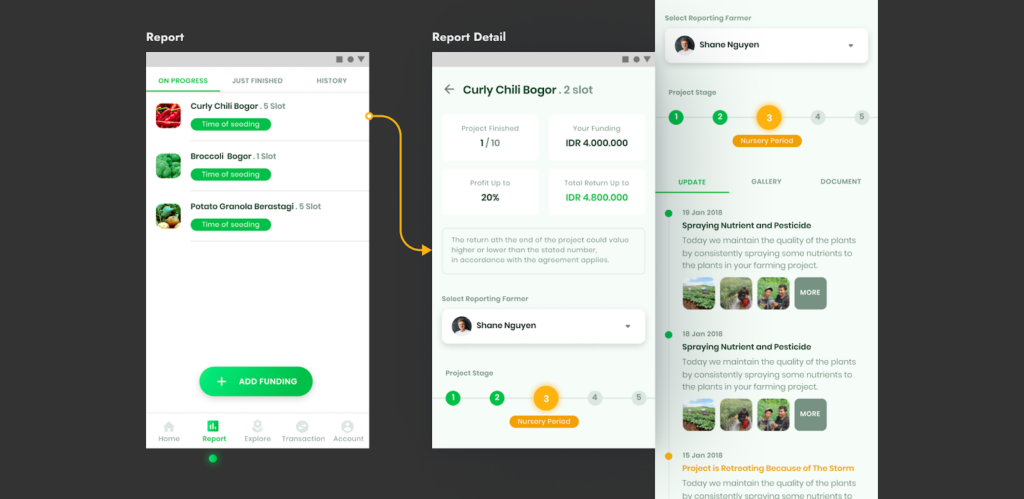
- Showing list of all user’s investment project including the detail report for each project
- Providing reports from all farmer. Users are able to choose whose report they want to see
- Showing the project stage to help user understanding the progress of each farming project
- Providing the updates of farmer’s activity to help users monitor whatever farmers do in the field
Explore and Fund Project Easily
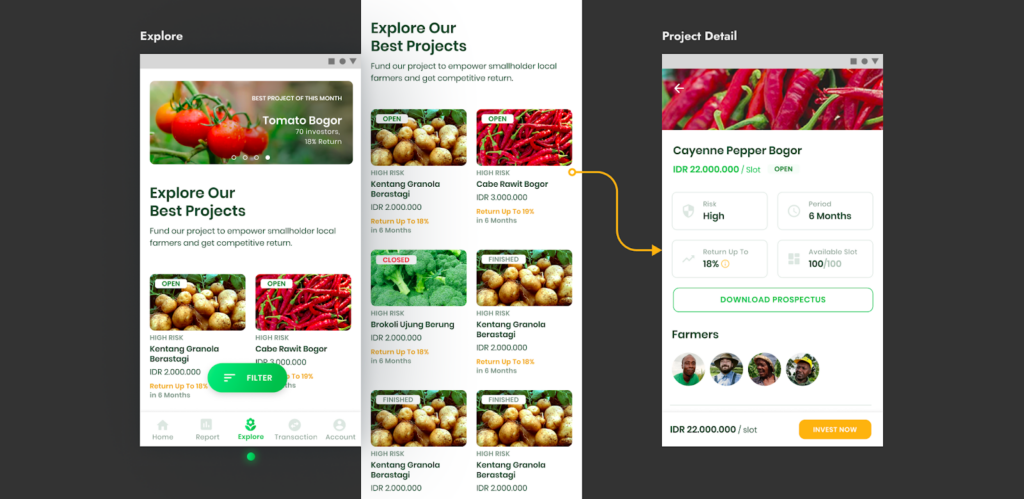
- Showing list of all project
- Sorting project based on status: from open, closed, to finished. This helps users to find the open project at first, but not hider them to explore the another
- Providing the most needed information on the thumbnail: Risk, Price, Return
- Providing filter & sort. User can filter based on project status and risk level. Also can sort based on price, return, and period. This helps users to find projects suit them.
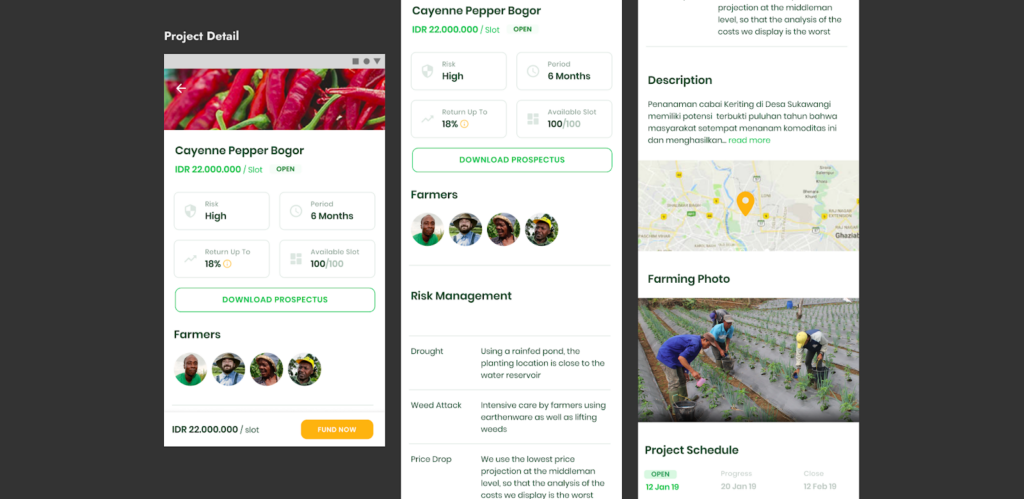
Placing the top 3 most needed information at the top: Risk, period, return
- Showing responsible farmers, risk management, and farming photo. This increases user trust and sense of secure
- Place all information in order based on user need (according to the questionnaire result)
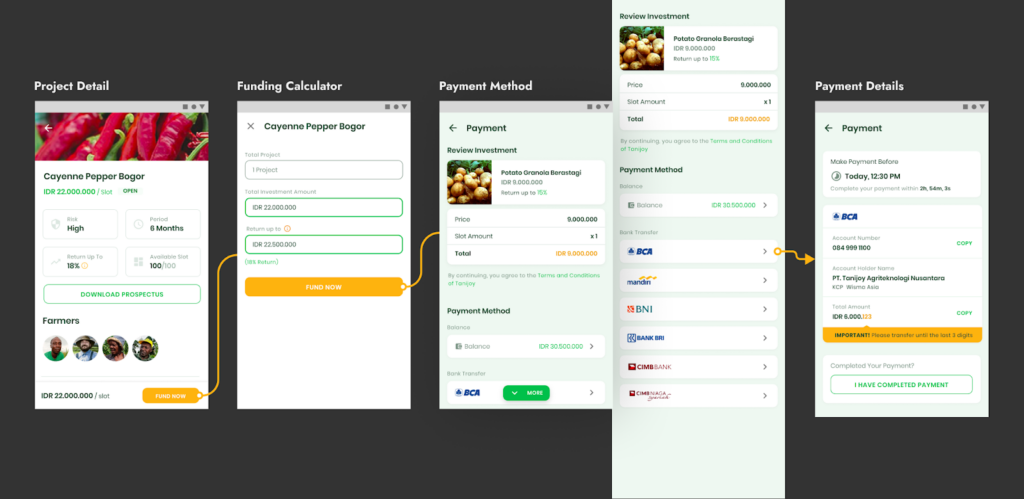
- Providing eCommerce-like checkout experience to the funding project flow
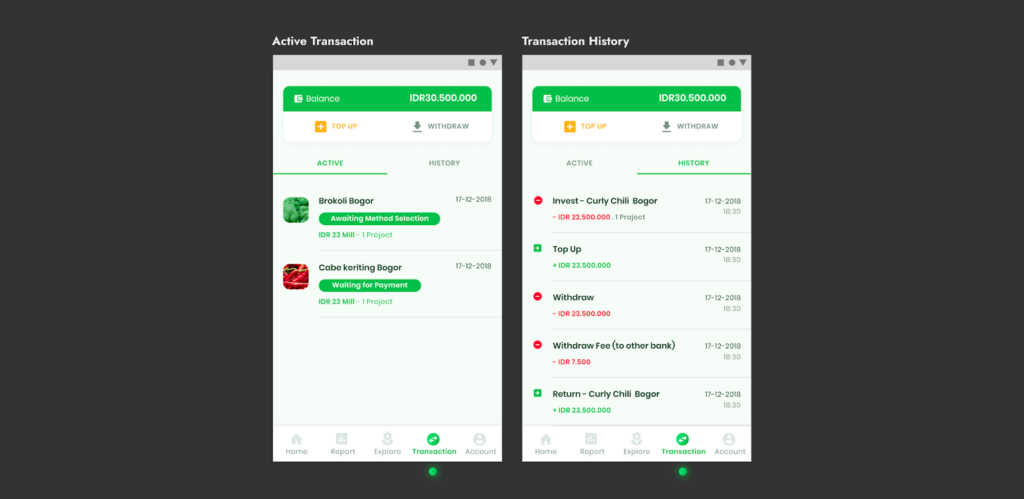
- Providing a wallet as alternative payment method alternative besides bank transfer. This helps user to fund projects easier and also a requirement of OJK.
- Showing active transaction for reminding user to finish the transaction
- Showing transaction history
🧪 User Testing
We conducted a Usability Testing method to validate ideas and gather some feedback from the users. We invited 3 participants who match Tanijoy’s personas and have never invested at Tanijoy before.
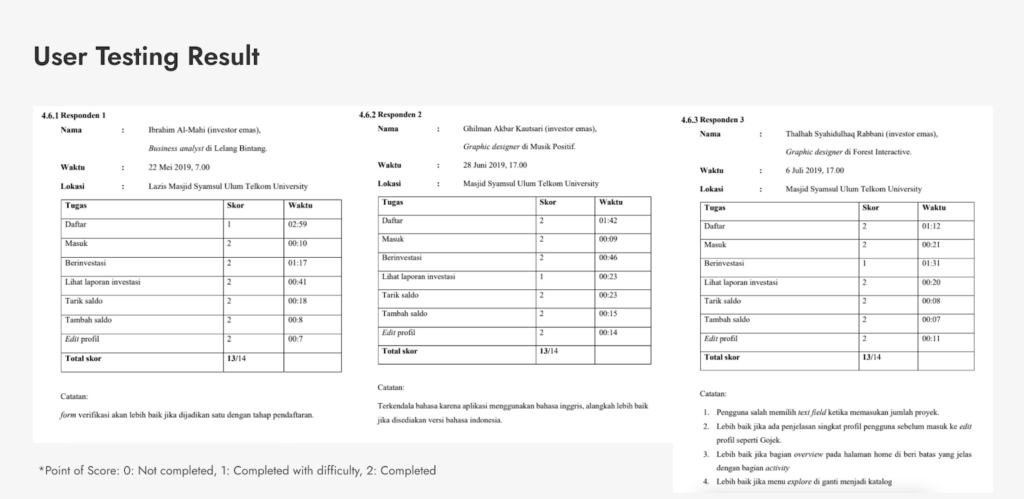
All participants were able to finish all of the tasks, yet we learned that there were some scenarios which couldn’t be completed flawlessly, such as Verification, View investment report, and investing. We will improve the pain points of each flow in the future based on this test.
🌻 Impact
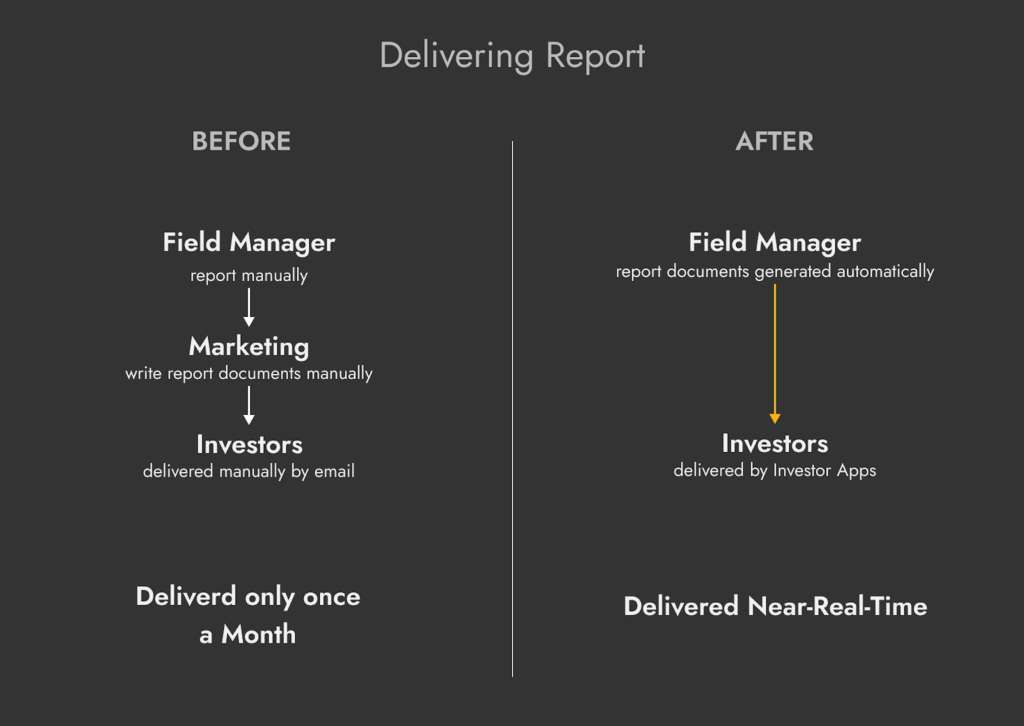
Tanijoy is now able to be more transparent to the investor since we can deliver more project report in a month. The investor only received a project report once a month before Tanijoy Investment App and Dashboard was released. However, now investor can receive more than one project report in a month even almost in real-time from the field. Investor is now able to see all farmer activity in the field from their own phone. If there is something happened to their farming project, our field manager can report it immediately to investors. This gains investor’s trust so Tanijoy can achieve 60% repeat order in 2019.
Leave a Reply